Description
Efnisyfirlit
- About this Book
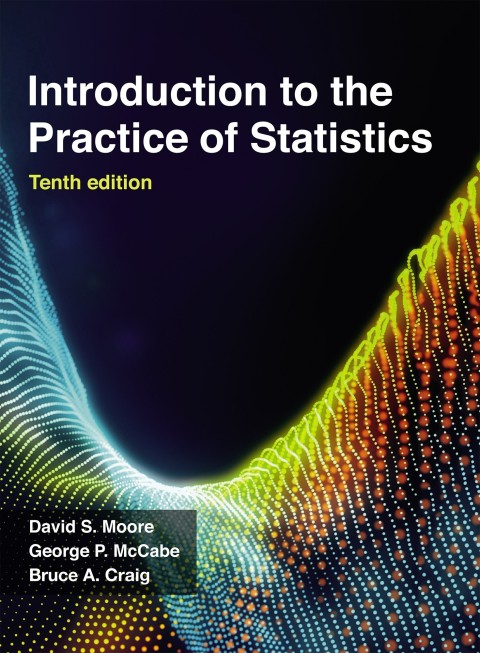
- Cover Page
- Title Page
- Copyright
- Brief Contents
- About the Authors
- Contents
- To Teachers: About This Book
- Preface
- To Students: What Is Statistics?
- Applications
- Data Table Index
- Beyond the Basics Index
- Part I Looking at Data
- Chapter 1 Looking at Data—Distributions
- Introduction
- 1.1 Data
- Key characteristics of a data set
- Section 1.1 Summary
- Section 1.1 Exercises
- 1.2 Displaying Distributions with Graphs
- Categorical variables: Bar graphs and pie charts
- Quantitative variables: Stemplots and histograms
- Histograms
- Examining distributions
- Dealing with outliers
- Time plots
- Section 1.2 Summary
- Section 1.2 Exercises
- 1.3 Describing Distributions with Numbers
- Measuring center: The mean
- Measuring center: The median
- Comparing the mean and the median
- Measuring spread: The quartiles
- The five-number summary and boxplots
- The 1.5 × IQR rule for suspected outliers
- Measuring spread: The standard deviation
- Properties of the standard deviation
- Choosing measures of center and spread
- Changing the unit of measurement
- Section 1.3 Summary
- Section 1.3 Exercises
- 1.4 Density Curves and Normal Distributions
- Density curves
- Measuring center and spread for density curves
- Normal distributions
- The 68–95–99.7 rule
- Standardizing observations
- Normal distribution calculations
- Using the standard Normal table
- Inverse Normal calculations
- Normal quantile plots
- Beyond the Basics: Density estimation
- Section 1.4 Summary
- Section 1.4 Exercises
- Chapter 1 Exercises
- Chapter 2 Looking at Data—Relationships
- Introduction
- 2.1 Relationships
- Examining relationships
- Section 2.1 Summary
- Section 2.1 Exercises
- 2.2 Scatterplots
- Interpreting scatterplots
- The log transformation
- Adding categorical variables to scatterplots
- Scatterplot smoothers
- Categorical explanatory variables
- Section 2.2 Summary
- Section 2.2 Exercises
- 2.3 Correlation
- The correlation r
- Properties of correlation
- Section 2.3 Summary
- Section 2.3 Exercises
- 2.4 Least-Squares Regression
- Fitting a line to data
- Prediction
- The least-squares regression line
- Facts about least-squares regression
- Correlation and regression
- Interpretation of r2
- Section 2.4 Summary
- Section 2.4 Exercises
- 2.5 Cautions about Correlation and Regression
- Extrapolation
- Residuals
- The distribution of the residuals
- Outliers and influential observations
- Beware of the lurking variable
- Beware of correlations based on averaged data
- Beware of restricted ranges
- Beyond the Basics: Data mining
- Section 2.5 Summary
- Section 2.5 Exercises
- 2.6 Data Analysis for Two-Way Tables
- The two-way table
- Joint distribution
- Marginal distributions
- Describing relations in two-way tables
- Conditional distributions
- Simpson’s paradox
- Section 2.6 Summary
- Section 2.6 Exercises
- 2.7 The Question of Causation
- Explaining association
- Establishing causation
- Section 2.7 Summary
- Section 2.7 Exercises
- Chapter 2 Exercises
- Chapter 3 Producing Data
- Introduction
- 3.1 Sources of Data
- Anecdotal data
- Available data
- Sample surveys and experiments
- Section 3.1 Summary
- Section 3.1 Exercises
- 3.2 Design of Experiments
- Comparative experiments
- Randomization
- Randomized comparative experiments
- How to randomize
- Randomization using software
- Randomization using random digits
- Cautions about experimentation
- Matched pairs designs
- Block designs
- Section 3.2 Summary
- Section 3.2 Exercises
- 3.3 Sampling Design
- Simple random samples
- How to select a simple random sample
- Stratified random samples
- Multistage random samples
- Cautions about sample surveys
- Beyond the Basics: Capture-recapture sampling
- Section 3.3 Summary
- Section 3.3 Exercises
- 3.4 Ethics
- Institutional review boards
- Informed consent
- Confidentiality
- Clinical trials
- Behavioral and social science experiments
- Section 3.4 Summary
- Section 3.4 Exercises
- Chapter 3 Exercises
- Part II Probability and Inference
- Chapter 4 Probability: The Study of Randomness
- Introduction
- 4.1 Randomness
- The language of probability
- Thinking about randomness
- The uses of probability
- Section 4.1 Summary
- Section 4.1 Exercises
- 4.2 Probability Models
- Sample spaces
- Probability rules
- Assigning probabilities: Finite number of outcomes
- Assigning probabilities: Equally likely outcomes
- Independence and the multiplication rule
- Applying the probability rules
- Section 4.2 Summary
- Section 4.2 Exercises
- 4.3 Random Variables
- Discrete random variables
- Continuous random variables
- Normal distributions as probability distributions
- Section 4.3 Summary
- Section 4.3 Exercises
- 4.4 Means and Variances of Random Variables
- The mean of a random variable
- Statistical estimation and the law of large numbers
- Thinking about the law of large numbers
- Beyond the Basics: More laws of large numbers
- Rules for means
- The variance of a random variable
- Rules for variances and standard deviations
- Section 4.4 Summary
- Section 4.4 Exercises
- 4.5 General Probability Rules
- General addition rules
- Conditional probability
- General multiplication rules
- Tree diagrams
- Bayes’s rule
- Independence again
- Section 4.5 Summary
- Section 4.5 Exercises
- Chapter 4 Exercises
- Chapter 5 Sampling Distributions
- Introduction
- 5.1 Toward Statistical Inference
- Sampling variability
- Sampling distributions
- Bias and variability
- Sampling from large populations
- Why randomize?
- Section 5.1 Summary
- Section 5.1 Exercises
- 5.2 The Sampling Distribution of a Sample Mean
- The mean and standard deviation of x
- The central limit theorem
- A few more facts related to the sampling distribution of x
- Beyond the Basics: Weibull distributions
- Section 5.2 Summary
- Section 5.2 Exercises
- 5.3 Sampling Distributions for Counts and Proportions
- The binomial distributions for sample counts
- Binomial distributions in statistical sampling
- Finding binomial probabilities
- Binomial mean and standard deviation
- Sample proportions
- Normal approximation for counts and proportions
- The continuity correction
- Binomial formula
- The Poisson distributions for sample counts
- Section 5.3 Summary
- Section 5.3 Exercises
- Chapter 5 Exercises
- Chapter 6 Introduction to Inference
- Introduction
- Overview of inference
- 6.1 Estimating with Confidence
- Statistical confidence
- Confidence intervals
- Confidence interval for a population mean
- How confidence intervals behave
- Choosing the sample size
- Some cautions
- Section 6.1 Summary
- Section 6.1 Exercises
- 6.2 Tests of Significance
- The reasoning of significance tests
- Stating hypotheses
- Test statistics
- P-values
- Statistical significance
- Tests for a population mean
- Two-sided significance tests and confidence intervals
- The P-value versus a statement of significance
- Section 6.2 Summary
- Section 6.2 Exercises
- 6.3 Use and Abuse of Tests
- Choosing a level of significance
- What statistical significance does not mean
- Don’t ignore lack of significance
- Statistical inference is not valid for all sets of data
- Beware of searching for significance
- Section 6.3 Summary
- Section 6.3 Exercises
- 6.4 Inference as a Decision
- Two types of error
- Error probabilities
- The common practice of testing hypotheses
- Section 6.4 Summary
- Section 6.4 Exercises
- Chapter 6 Exercises
- Chapter 7 Inference for Means
- Introduction
- 7.1 Inference for the Mean of a Population
- The t distributions
- One-sample t confidence interval
- The one-sample t test
- Using software
- Matched pairs t procedures
- Robustness of the t procedures
- Inference for non-normal populations
- Beyond the Basics: The bootstrap
- Section 7.1 Summary
- Section 7.1 Exercises
- 7.2 Comparing Two Means
- The two-sample z statistic
- The two-sample t procedures
- The two-sample t confidence interval
- The two-sample t significance test
- Robustness of the two-sample procedures
- Inference for small samples
- The pooled two-sample t procedures
- Section 7.2 Summary
- Section 7.2 Exercises
- 7.3 Sample Size Calculations
- Sample size for confidence intervals
- Power of a significance test
- Section 7.3 Summary
- Section 7.3 Exercises
- Chapter 7 Exercises
- Chapter 8 Inference for Proportions
- Introduction
- 8.1 Inference for a Single Proportion
- Large-sample confidence interval for a single proportion
- Beyond the Basics: Plus four confidence interval for a single proportion
- Significance test for a single proportion
- Choosing a sample size for a confidence interval
- Choosing a sample size for a significance test
- Section 8.1 Summary
- Section 8.1 Exercises
- 8.2 Comparing Two Proportions
- Large-sample confidence interval for a difference in proportions
- Beyond the Basics: Plus four confidence interval for a difference in proportions
- Significance test for a difference in proportions
- Choosing a sample size for two sample proportions
- Beyond the Basics: Relative risk
- Section 8.2 Summary
- Section 8.2 Exercises
- Chapter 8 Exercises
- Part III Topics in Inference
- Chapter 9 Inference for Categorical Data
- Introduction
- 9.1 Sources of Data
- The hypothesis: No association
- Expected cell counts
- The chi-square test
- Computations
- Computing conditional distributions
- The chi-square test and the z test
- Beyond the Basics: Meta-analysis
- Section 9.1 Summary
- Section 9.1 Exercises
- 9.2 Goodness of Fit
- Section 9.2 Summary
- Section 9.2 Exercises
- Chapter 9 Exercises
- Chapter 10 Inference for Regression
- Introduction
- 10.1 Simple Linear Regression
- Statistical model for linear regression
- Preliminary data analysis and inference considerations
- Revisiting the simple linear regression model
- Estimating the regression parameters
- Estimating the regression parameters
- Confidence intervals and significance tests
- Confidence intervals for mean response
- Prediction intervals
- Transforming variables
- Beyond the Basics: Nonlinear regression
- Section 10.1 Summary
- Section 10.1 Exercises
- 10.2 More Detail about Simple Linear Regression
- Analysis of variance for regression
- The ANOVA F test
- Calculations for regression inference
- Inference for correlation
- Section 10.2 Summary
- Section 10.2 Exercises
- Chapter 10 Exercises
- Chapter 11 Multiple Regression
- Introduction
- 11.1 Inference for Multiple Regression
- Population multiple regression equation
- Data for multiple regression
- Multiple linear regression model
- Estimation of the multiple regression parameters
- Confidence intervals and significance tests for regression coefficients
- ANOVA table for multiple regression
- Squared multiple correlation R2
- Section 11.1 Summary
- Section 11.1 Exercises
- 11.2 A Case Study
- Preliminary analysis
- Relationships between pairs of variables
- Fitting a multiple regression model
- Interpretation of results
- Examining the residuals
- Refining the model
- Considering other sets of explanatory variables
- Test for a collection of regression coefficients
- Beyond the Basics: Regression trees
- Section 11.2 Summary
- Section 11.2 Exercises
- Chapter 11 Exercises
- Chapter 12 One-Way Analysis of Variance
- Introduction
- 12.1 Inference for One-Way Analysis of Variance
- The one-way ANOVA setting
- Comparing means
- The two-sample t statistic
- An overview of ANOVA
- The ANOVA model
- Estimates of population parameters
- Testing hypotheses in one-way ANOVA
- The ANOVA table
- The F test
- Software
- Beyond the Basics: Testing the equality of spread
- Section 12.1 Summary
- Section 12.1 Exercises
- 12.2 Comparing the Means
- Contrasts
- Multiple comparisons
- Simultaneous confidence intervals
- Power of the one-way ANOVA F test
- Section 12.2 Summary
- Section 12.2 Exercises
- Chapter 12 Exercises
- Chapter 13 Two-Way Analysis of Variance
- Introduction
- 13.1 The Two-Way ANOVA Modell
- Advantages of two-way ANOVA
- The two-way ANOVA model
- Main effects and interactions
- Section 13.1 Summary
- Section 13.1 Exercises
- 13.2 Inference for Two-Way ANOVA
- The two-way ANOVA table
- Carrying out a two-way ANOVA
- Section 13.2 Summary
- Section 13.2 Exercises
- Chapter 13 Exercises
- Companion Chapters
- Chapter 14 Logistic Regression
- Introduction
- 14.1 The Logistic Regression Model
- Binomial distributions and odds
- Odds for two groups
- Model for logistic regression
- Fitting and interpreting the logistic regression model
- Section 14.1 Summary
- Section 14.1 Exercises
- 14.2 A Case Study
- Confidence intervals and significance tests
- Inference for multiple logistic regression
- Section 14.2 Summary
- Section 14.2 Exercises
- Chapter 14 Exercises
- Notes and Data Sources
- Chapter 15 Nonparametric Rank Tests
- Introduction
- 15.1 Inference for One-Way Analysis of Variance
- The rank transformation
- The Wilcoxon rank sum test
- The Normal approximation
- What hypotheses does Wilcoxon test?
- Ties
- Nonparametric rank and t procedures
- Section 15.1 Summary
- Section 15.1 Exercises
- 15.2 The Wilcoxon Signed Rank Test
- The Normal approximation
- Ties
- Testing a hypothesis about the median of a distribution
- Section 15.2 Summary
- Section 15.2 Exercises
- 15.3 The Kruskal-Wallis Test*
- Hypotheses and assumptions
- The Kruskal-Wallis test
- Section 15.3 Summary
- Section 15.3 Exercises
- Chapter 15 Exercises
- Notes and Data Sources
- Chapter 16 Bootstrap Methods and Permutation Tests
- Introduction
- Software
- 16.1 The Bootstrap Idea
- The big idea: Resampling and the bootstrap distribution
- Thinking about the bootstrap idea
- Using software
- Section 16.1 Summary
- Section 16.1 Exercises
- 16.2 First Steps in Using the Bootstrap
- Bootstrap t confidence intervals
- Bootstrapping to compare two groups
- Beyond the Basics: The bootstrap for a scatterplot smoother
- Section 16.2 Summary
- Section 16.2 Exercises
- 16.3 How Accurate Is a Bootstrap Distribution?
- Bootstrapping small samples
- Bootstrapping a sample median
- Section 16.3 Summary
- Section 16.3 Exercises
- 16.4 Bootstrap Confidence Intervals
- Bootstrap percentile confidence intervals
- A more accurate bootstrap confidence interval: BCa
- Confidence intervals for the correlation
- Section 16.4 Summary
- Section 16.4 Exercises
- 16.5 Significance Testing Using Permutation Tests
- Using software
- Permutation tests in practice
- Permutation tests in other settings
- Section 16.5 Summary
- Section 16.5 Exercises
- Chapter 16 Exercises
- Notes and Data Sources
- Chapter 17 Statistics for Quality: Control and Capability
- Introduction
- 17.1 Processes and Statistical Process Control
- Describing processes
- Statistical process control
- x charts for process monitoring
- s charts for process monitoring
- Section 17.1 Summary
- Section 17.1 Exercises
- 17.2 Using Control Charts
- x and R charts
- Additional out-of-control rules
- Setting up control charts
- Comments on statistical control
- Don’t confuse control with capability!
- Section 17.2 Summary
- Section 17.2 Exercises
- 17.3 Process Capability Indexes
- The capability indexes Cp and Cpk
- Cautions about capability indexes
- Section 17.3 Summary
- Section 17.3 Exercises
- 17.4 Control Charts for Sample Proportions
- Control limits for p charts
- Section 17.4 Summary
- Section 17.4 Exercises
- Chapter 17 Exercises
- Notes and Data Sources
- Tables
- Answers to Odd-Numbered Exercises
- Chapter 1
- Chapter 2
- Chapter 3
- Chapter 4
- Chapter 5
- Chapter 6
- Chapter 7
- Chapter 8
- Chapter 9
- Chapter 10
- Chapter 11
- Chapter 12
- Chapter 13
- Chapter 14
- Chapter 15
- Chapter 16
- Chapter 17
- Notes and Data Sources
- Index
- Formulas and Key Ideas
- Back Cover


