Description
Efnisyfirlit
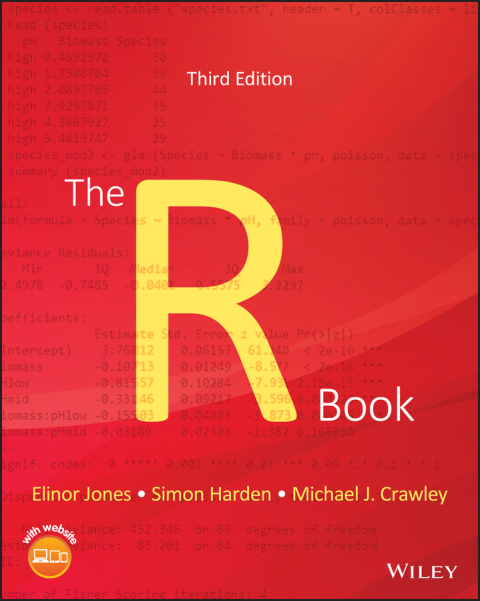
- Cover
- Title Page
- Copyright
- List of Tables
- Preface
- Acknowledgments
- About the Companion Website
- 1 Getting Started
- 1.1 Navigating the book
- 1.2 vs. RStudio
- 1.3 Installing and RStudio
- 1.4 Using RStudio
- 1.5 The Comprehensive Archive Network
- 1.6 Packages in
- 1.7 Getting help in
- 1.8 Good housekeeping
- 1.9 Linking to other computer languages
- References
- 2 Technical Background
- 2.1 Mathematical functions
- 2.2 Matrices
- 2.3 Calculus
- 2.4 Probability
- 2.5 Statistics
- Reference
- 3 Essentials of the Language
- 3.1 Calculations
- 3.2 Naming objects
- 3.3 Factors
- 3.4 Logical operations
- 3.5 Generating sequences
- 3.6 Class membership
- 3.7 Missing values, infinity, and things that are not numbers
- 3.8 Vectors and subscripts
- 3.9 Working with logical subscripts
- 3.10 Vector functions
- 3.11 Matrices and arrays
- 3.12 Random numbers, sampling, and shuffling
- 3.13 Loops and repeats
- 3.14 Lists
- 3.15 Text, character strings, and pattern matching
- 3.16 Dates and times in
- 3.17 Environments
- 3.18 Writing functions
- 3.19 Structure of objects
- 3.20 Writing from to a file
- 3.21 Tips for writing code
- References
- 4 Data Input and Dataframes
- 4.1 Working directory
- 4.2 Data input from files
- 4.3 Data input directly from the web
- 4.4 Built‐in data files
- 4.5 Dataframes
- 4.6 Using the match () function in dataframes
- 4.7 Adding margins to a dataframe
- 5 Graphics
- 5.1 Plotting principles
- 5.2 Plots for single variables
- 5.3 Plots for showing two numeric variables
- 5.4 Plots for numeric variables by group
- 5.5 Plots showing two categorical variables
- 5.6 Plots for three (or more) variables
- 5.7 Trellis graphics
- 5.8 Plotting functions
- References
- 6 Graphics in More Detail
- 6.1 More on colour
- 6.2 Changing the look of graphics
- 6.3 Adding items to plots
- 6.4 The grammar of graphics and ggplot2
- 6.5 Graphics cheat sheet
- References
- 7 Tables
- 7.1 Tabulating categorical or discrete data
- 7.2 Tabulating summaries of numeric data
- 7.3 Converting between tables and dataframes
- Reference
- 8 Probability Distributions in
- 8.1 Probability distributions: the basics
- 8.2 Probability distributions in
- 8.3 Continuous probability distributions
- 8.4 Discrete probability distributions
- 8.5 The central limit theorem
- References
- 9 Testing
- 9.1 Principles
- 9.2 Continuous data
- 9.3 Discrete and categorical data
- 9.4 Bootstrapping
- 9.5 Multiple tests
- 9.6 Power and sample size calculations
- 9.7 A table of tests
- References
- 10 Regression
- 10.1 The simple linear regression model
- 10.2 The multiple linear regression model
- 10.3 Understanding the output
- 10.4 Fitting models
- 10.5 Checking model assumptions
- 10.6 Using the model
- 10.7 Further types of regression modelling
- References
- 11 Generalised Linear Models
- 11.1 How GLMs work
- 11.2 Count data and GLMs
- 11.3 Count table data and GLMs
- 11.4 Proportion data and GLMs
- 11.5 Binary Response Variables and GLMs
- 11.6 Bootstrapping a GLM
- References
- 12 Generalised Additive Models
- 12.1 Smoothing example
- 12.2 Straightforward examples of GAMs
- 12.3 Background to using GAMs
- 12.4 More complex GAM examples
- References
- 13 Mixed‐Effect Models
- 13.1 Regression with categorical covariates
- 13.2 An alternative method: random effects
- 13.3 Common data structures where random effects are useful
- 13.4 packages to deal with mixed effects models
- 13.5 Examples of implementing random effect models
- 13.6 Generalised linear mixed models
- 13.7 Alternatives to mixed models
- References
- 14 Non‐linear Regression
- 14.1 Example: modelling deer jaw bone length
- 14.2 Example: grouped data
- 14.3 Self‐starting functions
- 14.4 Further considerations
- References
- 15 Survival Analysis
- 15.1 Handling survival data
- 15.2 The survival and hazard functions
- 15.3 Modelling survival data
- References
- 16 Designed Experiments
- 16.1 Factorial experiments
- 16.2 Pseudo‐replication
- 16.3 Contrasts
- References
- 17 Meta‐Analysis
- 17.1 Elements of a meta‐analysis
- 17.2 Meta‐analysis in
- 17.3 Examples
- 17.4 Meta‐analysis of categorical data
- References
- 18 Time Series
- 18.1 Moving average
- 18.2 Blowflies
- 18.3 Seasonal data
- 18.4 Multiple time series
- 18.5 Some theoretical background
- 18.6 ARIMA example
- 18.7 Simulation of time series
- Reference
- 19 Multivariate Statistics
- 19.1 Visualising data
- 19.2 Multivariate analysis of variance
- 19.3 Principal component analysis
- 19.4 Factor analysis
- 19.5 Cluster analysis
- 19.6 Hierarchical cluster analysis
- 19.7 Discriminant analysis
- 19.8 Neural networks
- References
- 20 Classification and Regression Trees
- 20.1 How CARTs work
- 20.2 Regression trees
- 20.3 Classification trees
- 20.4 Looking for patterns
- References
- 21 Spatial Statistics
- 21.1 Spatial point processes
- 21.2 Geospatial statistics
- References
- 22 Bayesian Statistics
- 22.1 Components of a Bayesian Analysis
- 22.2 Bayesian analysis in
- 22.3 Examples
- 22.4 MCMC for a model with binomial errors
- References
- 23 Simulation Models
- 23.1 Temporal dynamics
- 23.2 Spatial simulation models
- 23.3 Temporal and spatial dynamics: random walk
- References
- Index
- End User License Agreement


Reviews
There are no reviews yet.