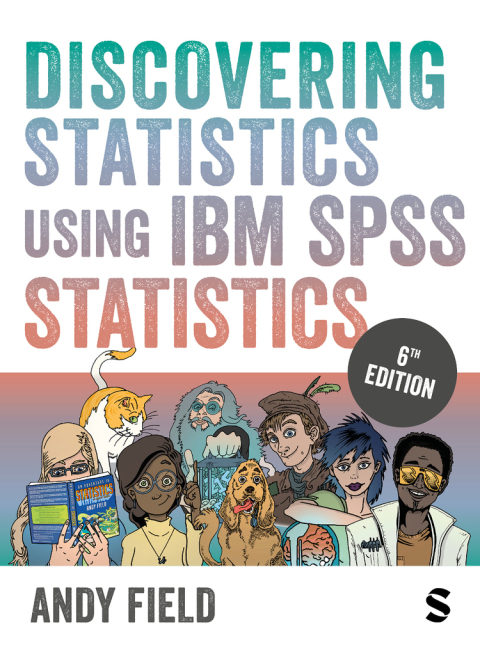
Description
Efnisyfirlit
- Preface
- How to use this book
- Thank you
- Symbols used in this book
- A brief maths overview
- 1 Why is my evil lecturer forcing me to learn statistics?
- 1.1 What the hell am I doing here? I don’t belong here
- 1.2 The research process
- 1.3 Initial observation: finding something that needs explaining
- 1.4 Generating and testing theories and hypotheses
- 1.5 Collecting data: measurement
- 1.6 Collecting data: research design
- 1.7 Analysing data
- 1.8 Reporting data
- 1.9 Jane and Brian’s story
- 1.10 What next?
- 1.11 key terms that I’ve discovered
- Smart Alex’s tasks
- 2 The SPINE of statistics
- 2.1 What will this chapter tell me?
- 2.2 What is the SPINE of statistics?
- 2.3 Statistical models
- 2.4 Populations and samples
- 2.5 The linear model
- 2.6 P is for parameters
- 2.7 E is for estimating parameters
- 2.8 S is for standard error
- 2.9 I is for (confidence) interval
- 2.10 N is for null hypothesis significance testing
- 2.11 Reporting significance tests
- 2.12 Jane and Brian’s story
- 2.13 What next?
- 2.14 Key terms that I’ve discovered
- Smart Alex’s tasks
- 3 The phoenix of statistics
- 3.1 What will this chapter tell me?
- 3.2 Problems with NHST
- 3.3 NHST as part of wider problems with science
- 3.4 A phoenix from the EMBERS
- 3.5 Sense, and how to use it
- 3.6 Preregistering research and open science
- 3.7 Effect sizes
- 3.8 Bayesian approaches
- 3.9 Reporting effect sizes and Bayes factors
- 3.10 Jane and Brian’s story
- 3.11 What next?
- 3.12 Key terms that I’ve discovered
- Smart Alex’s tasks
- 4 The IBM SPSS Statistics environment
- 4.1 What will this chapter tell me?
- 4.2 Versions of IBM SPSS Statistics
- 4.3 Windows, Mac OS and Linux
- 4.4 Getting started
- 4.5 The data editor
- 4.6 Entering data into IBM SPSS Statistics
- 4.7 SPSS syntax
- 4.8 The SPSS viewer
- 4.9 Exporting SPSS output
- 4.10 Saving files and restore points
- 4.11 Opening files and restore points
- 4.12 A few useful options
- 4.13 Extending IBM SPSS Statistics
- 4.14 Jane and Brian’s story
- 4.15 What next?
- 4.16 Key terms that I’ve discovered
- Smart Alex’s tasks
- 5 Visualizing data
- 5.1 What will this chapter tell me?
- 5.2 The art of visualizing data
- 5.3 The SPSS Chart Builder
- 5.4 Histograms
- 5.5 Boxplots (box–whisker diagrams)
- 5.6 Visualizing means: bar charts and error bars
- 5.7 Line charts
- 5.8 Visualizing relationships: the scatterplot
- 5.9 Editing plots
- 5.10 Brian and Jane’s story
- 5.11 What next?
- 5.12 Key terms that I’ve discovered
- Smart Alex’s tasks
- 6 The beast of bias
- 6.1 What will this chapter tell me?
- 6.2 Descent into statistics hell
- 6.3 What is bias?
- 6.4 Outliers
- 6.5 Overview of assumptions
- 6.6 Linearity and additivity
- 6.7 Spherical errors
- 6.8 Normally distributed something or other
- 6.9 Checking for bias and describing data
- 6.10 Reducing bias with robust methods
- 6.11 A final note
- 6.12 Jane and Brian’s story
- 6.13 What next?
- 6.14 Key terms that I’ve discovered
- Smart Alex’s tasks
- 7 Non-parametric models
- 7.1 What will this chapter tell me?
- 7.2 When to use non-parametric tests
- 7.3 General procedure of non-parametric tests using SPSS
- 7.4 Comparing two independent conditions: the Wilcoxon rank-sum test and Mann–Whitney test
- 7.5 Comparing two related conditions: the Wilcoxon signed-rank test
- 7.6 Differences between several independent groups: the Kruskal–Wallis test
- 7.7 Differences between several related groups: Friedman’s ANOVA
- 7.8 Jane and Brian’s story
- 7.9 What next?
- 7.10 Key terms that I’ve discovered
- Smart Alex’s tasks
- 8 Correlation
- 8.1 What will this chapter tell me?
- 8.2 Modelling relationships
- 8.3 Data entry for correlation analysis
- 8.4 Bivariate correlation
- 8.5 Partial and semi-partial correlation
- 8.6 Comparing correlations
- 8.7 Calculating the effect size
- 8.8 How to report correlation coefficients
- 8.9 Jane and Brian’s story
- 8.10 What next?
- 8.11 Key terms that I’ve discovered
- Smart Alex’s tasks
- 9 The linear model (regression)
- 9.1 What will this chapter tell me?
- 9.2 The linear model (regression) … again!
- 9.3 Bias in linear models
- 9.4 Generalizing the model
- 9.5 Sample size and the linear model
- 9.6 Fitting linear models: the general procedure
- 9.7 Using SPSS to fit a linear model with one predictor
- 9.8 Interpreting a linear model with one predictor
- 9.9 The linear model with two or more predictors (multiple regression)
- 9.10 Using SPSS to fit a linear model with several predictors
- 9.11 Interpreting a linear model with several predictors
- 9.12 Robust regression
- 9.13 Bayesian regression
- 9.14 Reporting linear models
- 9.15 Jane and Brian’s story
- 9.16 What next?
- 9.17 Key terms that I’ve discovered
- Smart Alex’s tasks
- 10 Categorical predictors: Comparing two means
- 10.1 What will this chapter tell me?
- 10.2 Looking at differences
- 10.3 A mischievous example
- 10.4 Categorical predictors in the linear model
- 10.5 The t-test
- 10.6 Assumptions of the t-test
- 10.7 Comparing two means: general procedure
- 10.8 Comparing two independent means using SPSS
- 10.9 Comparing two related means using SPSS
- 10.10 Reporting comparisons between two means
- 10.11 Between groups or repeated measures?
- 10.12 Jane and Brian’s story
- 10.13 What next?
- 10.14 Key terms that I’ve discovered
- Smart Alex’s tasks
- 11 Moderation and mediation
- 11.1 What will this chapter tell me?
- 11.2 The PROCESS tool
- 11.3 Moderation: interactions in the linear model
- 11.4 Mediation
- 11.5 Jane and Brian’s story
- 11.6 What next?
- 11.7 Key terms that I’ve discovered
- Smart Alex’s tasks
- 12 GLM 1: Comparing several independent means
- 12.1 What will this chapter tell me?
- 12.2 A puppy-tastic example
- 12.3 Compare several means with the linear model
- 12.4 Assumptions when comparing means
- 12.5 Planned contrasts (contrast coding)
- 12.6 Post hoc procedures
- 12.7 Effect sizes when comparing means
- 12.8 Comparing several means using SPSS
- 12.9 Output from one-way independent ANOVA
- 12.10 Robust comparisons of several means
- 12.11 Bayesian comparison of several means
- 12.12 Reporting results from one-way independent ANOVA
- 12.13 Jane and Brian’s story
- 12.14 What next?
- 12.15 Key terms that I’ve discovered
- Smart Alex’s tasks
- 13 GLM 2: Comparing means adjusted for other predictors (analysis of covariance)
- 13.1 What will this chapter tell me?
- 13.2 What is ANCOVA?
- 13.3 The general linear model with covariates
- 13.4 Effect size for ANCOVA
- 13.5 Assumptions and issues in ANCOVA designs
- 13.6 Conducting ANCOVA using SPSS
- 13.7 Interpreting ANCOVA
- 13.8 The non-parallel slopes model and the assumption of homogeneity of regression slopes
- 13.9 Robust ANCOVA
- 13.10 Bayesian analysis with covariates
- 13.11 Reporting results
- 13.12 Jane and Brian’s story
- 13.13 What next?
- 13.14 Key terms that I’ve discovered
- Smart Alex’s tasks
- 14 GLM 3: Factorial designs
- 14.1 What will this chapter tell me?
- 14.2 Factorial designs
- 14.3 A goggly example
- 14.4 Independent factorial designs and the linear model
- 14.5 Interpreting interaction plots
- 14.6 Simple effects analysis
- 14.7 F-statistics in factorial designs
- 14.8 Model assumptions in factorial designs
- 14.9 Factorial designs using SPSS
- 14.10 Output from factorial designs
- 14.11 Robust models of factorial designs
- 14.12 Bayesian models of factorial designs
- 14.13 More effect sizes
- 14.14 Reporting the results of factorial designs
- 14.15 Jane and Brian’s story
- 14.16 What next?
- 14.17 Key terms that I’ve discovered
- Smart Alex’s tasks
- 15 GLM 4: Repeated-measures designs
- 15.1 What will this chapter tell me?
- 15.2 Introduction to repeated-measures designs
- 15.3 Emergency! The aliens are coming!
- 15.4 Repeated measures and the linear model
- 15.5 The ANOVA approach to repeated-measures designs
- 15.6 The F-statistic for repeated-measures designs
- 15.7 Assumptions in repeated-measures designs
- 15.8 One-way repeated-measures designs using SPSS
- 15.9 Output for one-way repeated-measures designs
- 15.10 Robust tests of one-way repeated-measures designs
- 15.11 Effect sizes for one-way repeated-measures designs
- 15.12 Reporting one-way repeated-measures designs
- 15.13 A scented factorial repeated-measures design
- 15.14 Factorial repeated-measures designs using SPSS
- 15.15 Interpreting factorial repeated-measures designs
- 15.16 Reporting the results from factorial repeated-measures designs
- 15.17 Jane and Brian’s story
- 15.18 What next?
- 15.19 Key terms that I’ve discovered
- Smart Alex’s tasks
- 16 GLM 5: Mixed designs
- 16.1 What will this chapter tell me?
- 16.2 Mixed designs
- 16.3 Assumptions in mixed designs
- 16.4 A speed-dating example
- 16.5 Mixed designs using SPSS
- 16.6 Output for mixed factorial designs
- 16.7 Reporting the results of mixed designs
- 16.8 Jane and Brian’s story
- 16.9 What next?
- 16.10 Key terms that I’ve discovered
- Smart Alex’s tasks
- 17 Multivariate analysis of variance (MANOVA)
- 17.1 What will this chapter tell me?
- 17.2 Introducing MANOVA
- 17.3 The theory behind MANOVA
- 17.4 Practical issues when conducting MANOVA
- 17.5 MANOVA using SPSS
- 17.6 Interpreting MANOVA
- 17.7 Reporting results from MANOVA
- 17.8 Following up MANOVA with discriminant analysis
- 17.9 Interpreting discriminant analysis
- 17.10 Reporting results from discriminant analysis
- 17.11 The final interpretation
- 17.12 Jane and Brian’s story
- 17.13 What next?
- 17.14 Key terms that I’ve discovered
- Smart Alex’s tasks
- 18 Exploratory factor analysis
- 18.1 What will this chapter tell me?
- 18.2 When to use factor analysis
- 18.3 Factors and components
- 18.4 Discovering factors
- 18.5 An anxious example
- 18.6 Factor analysis using SPSS
- 18.7 Interpreting factor analysis
- 18.8 How to report factor analysis
- 18.9 Reliability analysis
- 18.10 Reliability analysis using SPSS
- 18.11 Interpreting reliability analysis
- 18.12 How to report reliability analysis
- 18.13 Jane and Brian’s story
- 18.14 What next?
- 18.15 Key terms that I’ve discovered
- Smart Alex’s tasks
- 19 Categorical outcomes: chi-square and loglinear analysis
- 19.1 What will this chapter tell me?
- 19.2 Analysing categorical data
- 19.3 Associations between two categorical variables
- 19.4 Associations between several categorical variables: loglinear analysis
- 19.5 Assumptions when analysing categorical data
- 19.6 General procedure for analysing categorical outcomes
- 19.7 Doing chi-square using SPSS
- 19.8 Interpreting the chi-square test
- 19.9 Loglinear analysis using SPSS
- 19.10 Interpreting loglinear analysis
- 19.11 Reporting the results of loglinear analysis
- 19.12 Jane and Brian’s story
- 19.13 What next?
- 19.14 Key terms that I’ve discovered
- Smart Alex’s tasks
- 20 Categorical outcomes: logistic regression
- 20.1 What will this chapter tell me?
- 20.2 What is logistic regression?
- 20.3 Theory of logistic regression
- 20.4 Sources of bias and common problems
- 20.5 Binary logistic regression
- 20.6 Interpreting logistic regression
- 20.7 Interactions in logistic regression: a sporty example
- 20.8 Reporting logistic regression
- 20.9 Jane and Brian’s story
- 20.10 What next?
- 20.11 Key terms that I’ve discovered
- Smart Alex’s tasks
- 21 Multilevel linear models
- 21.1 What will this chapter tell me?
- 21.2 Hierarchical data
- 21.3 Multilevel linear models
- 21.4 Practical issues
- 21.5 Multilevel modelling using SPSS
- 21.6 How to report a multilevel model
- 21.7 A message from the octopus of inescapable despair
- 21.8 Jane and Brian’s story
- 21.9 What next?
- 21.10 Key terms that I’ve discovered
- Smart Alex’s tasks
- Epilogue
- Appendix
- Glossary
- References
- Index


Reviews
There are no reviews yet.