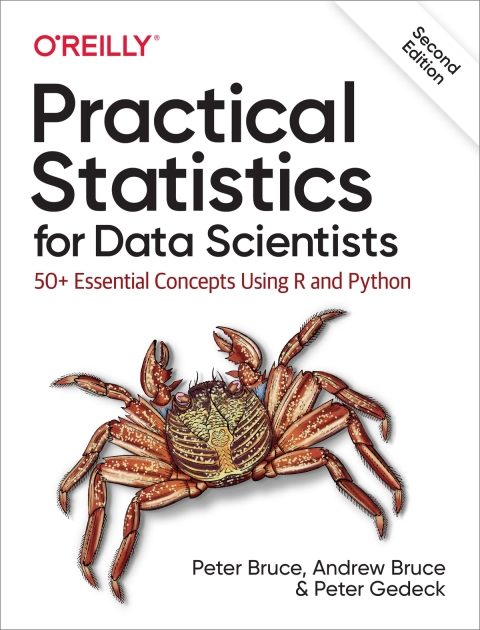
Description
Efnisyfirlit
- Preface
- Conventions Used in This Book
- Using Code Examples
- O’Reilly Online Learning
- How to Contact Us
- Acknowledgments
- 1. Exploratory Data Analysis
- Elements of Structured Data
- Further Reading
- Rectangular Data
- Data Frames and Indexes
- Nonrectangular Data Structures
- Further Reading
- Estimates of Location
- Mean
- Median and Robust Estimates
- Example: Location Estimates of Population and Murder Rates
- Further Reading
- Estimates of Variability
- Standard Deviation and Related Estimates
- Estimates Based on Percentiles
- Example: Variability Estimates of State Population
- Further Reading
- Exploring the Data Distribution
- Percentiles and Boxplots
- Frequency Tables and Histograms
- Density Plots and Estimates
- Further Reading
- Exploring Binary and Categorical Data
- Mode
- Expected Value
- Probability
- Further Reading
- Correlation
- Scatterplots
- Further Reading
- Exploring Two or More Variables
- Hexagonal Binning and Contours (Plotting Numeric Versus Numeric Data)
- Two Categorical Variables
- Categorical and Numeric Data
- Visualizing Multiple Variables
- Further Reading
- Summary
- 2. Data and Sampling Distributions
- Random Sampling and Sample Bias
- Bias
- Random Selection
- Size Versus Quality: When Does Size Matter?
- Sample Mean Versus Population Mean
- Further Reading
- Selection Bias
- Regression to the Mean
- Further Reading
- Sampling Distribution of a Statistic
- Central Limit Theorem
- Standard Error
- Further Reading
- The Bootstrap
- Resampling Versus Bootstrapping
- Further Reading
- Confidence Intervals
- Further Reading
- Normal Distribution
- Standard Normal and QQ-Plots
- Long-Tailed Distributions
- Further Reading
- Student’s t-Distribution
- Further Reading
- Binomial Distribution
- Further Reading
- Chi-Square Distribution
- Further Reading
- F-Distribution
- Further Reading
- Poisson and Related Distributions
- Poisson Distributions
- Exponential Distribution
- Estimating the Failure Rate
- Weibull Distribution
- Further Reading
- Summary
- 3. Statistical Experiments and Significance Testing
- A/B Testing
- Why Have a Control Group?
- Why Just A/B? Why Not C, D,…?
- Further Reading
- Hypothesis Tests
- The Null Hypothesis
- Alternative Hypothesis
- One-Way Versus Two-Way Hypothesis Tests
- Further Reading
- Resampling
- Permutation Test
- Example: Web Stickiness
- Exhaustive and Bootstrap Permutation Tests
- Permutation Tests: The Bottom Line for Data Science
- Further Reading
- Statistical Significance and p-Values
- p-Value
- Alpha
- Type 1 and Type 2 Errors
- Data Science and p-Values
- Further Reading
- t-Tests
- Further Reading
- Multiple Testing
- Further Reading
- Degrees of Freedom
- Further Reading
- ANOVA
- F-Statistic
- Two-Way ANOVA
- Further Reading
- Chi-Square Test
- Chi-Square Test: A Resampling Approach
- Chi-Square Test: Statistical Theory
- Fisher’s Exact Test
- Relevance for Data Science
- Further Reading
- Multi-Arm Bandit Algorithm
- Further Reading
- Power and Sample Size
- Sample Size
- Further Reading
- Summary
- 4. Regression and Prediction
- Simple Linear Regression
- The Regression Equation
- Fitted Values and Residuals
- Least Squares
- Prediction Versus Explanation (Profiling)
- Further Reading
- Multiple Linear Regression
- Example: King County Housing Data
- Assessing the Model
- Cross-Validation
- Model Selection and Stepwise Regression
- Weighted Regression
- Further Reading
- Prediction Using Regression
- The Dangers of Extrapolation
- Confidence and Prediction Intervals
- Factor Variables in Regression
- Dummy Variables Representation
- Factor Variables with Many Levels
- Ordered Factor Variables
- Interpreting the Regression Equation
- Correlated Predictors
- Multicollinearity
- Confounding Variables
- Interactions and Main Effects
- Regression Diagnostics
- Outliers
- Influential Values
- Heteroskedasticity, Non-Normality, and Correlated Errors
- Partial Residual Plots and Nonlinearity
- Polynomial and Spline Regression
- Polynomial
- Splines
- Generalized Additive Models
- Further Reading
- Summary
- 5. Classification
- Naive Bayes
- Why Exact Bayesian Classification Is Impractical
- The Naive Solution
- Numeric Predictor Variables
- Further Reading
- Discriminant Analysis
- Covariance Matrix
- Fisher’s Linear Discriminant
- A Simple Example
- Further Reading
- Logistic Regression
- Logistic Response Function and Logit
- Logistic Regression and the GLM
- Generalized Linear Models
- Predicted Values from Logistic Regression
- Interpreting the Coefficients and Odds Ratios
- Linear and Logistic Regression: Similarities and Differences
- Assessing the Model
- Further Reading
- Evaluating Classification Models
- Confusion Matrix
- The Rare Class Problem
- Precision, Recall, and Specificity
- ROC Curve
- AUC
- Lift
- Further Reading
- Strategies for Imbalanced Data
- Undersampling
- Oversampling and Up/Down Weighting
- Data Generation
- Cost-Based Classification
- Exploring the Predictions
- Further Reading
- Summary
- 6. Statistical Machine Learning
- K-Nearest Neighbors
- A Small Example: Predicting Loan Default
- Distance Metrics
- One Hot Encoder
- Standardization (Normalization, z-Scores)
- Choosing K
- KNN as a Feature Engine
- Tree Models
- A Simple Example
- The Recursive Partitioning Algorithm
- Measuring Homogeneity or Impurity
- Stopping the Tree from Growing
- Predicting a Continuous Value
- How Trees Are Used
- Further Reading
- Bagging and the Random Forest
- Bagging
- Random Forest
- Variable Importance
- Hyperparameters
- Boosting
- The Boosting Algorithm
- XGBoost
- Regularization: Avoiding Overfitting
- Hyperparameters and Cross-Validation
- Summary
- 7. Unsupervised Learning
- Principal Components Analysis
- A Simple Example
- Computing the Principal Components
- Interpreting Principal Components
- Correspondence Analysis
- Further Reading
- K-Means Clustering
- A Simple Example
- K-Means Algorithm
- Interpreting the Clusters
- Selecting the Number of Clusters
- Hierarchical Clustering
- A Simple Example
- The Dendrogram
- The Agglomerative Algorithm
- Measures of Dissimilarity
- Model-Based Clustering
- Multivariate Normal Distribution
- Mixtures of Normals
- Selecting the Number of Clusters
- Further Reading
- Scaling and Categorical Variables
- Scaling the Variables
- Dominant Variables
- Categorical Data and Gower’s Distance
- Problems with Clustering Mixed Data
- Summary
- Bibliography
- Index


Reviews
There are no reviews yet.