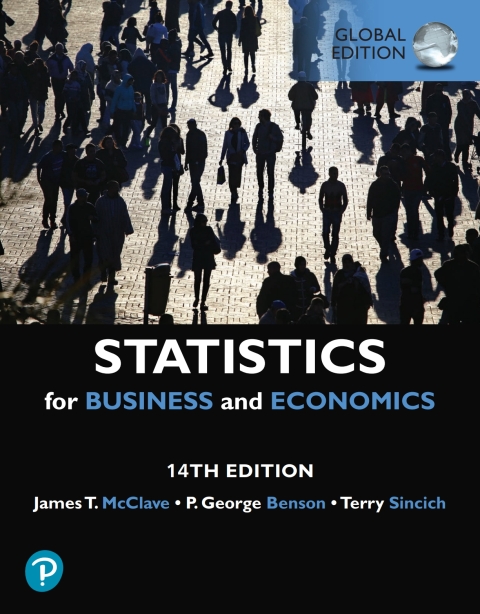
Description
Efnisyfirlit
- Applet Correlation
- Half Title
- Title Page
- Copyright
- Contents
- Preface
- Acknowledgments
- MyLab Statistics Resources for Success
- Chapter 1. Statistics, Data, and Statistical Thinking
- 1.1 The Science of Statistics
- 1.2 Types of Statistical Applications in Business
- 1.3 Fundamental Elements of Statistics
- 1.4 Processes (Optional)
- 1.5 Types of Data
- 1.6 Collecting Data: Sampling and Related Issues
- 1.7 Business Analytics: Critical Thinking with Statistics
- Statistics In Action: A 20/20 View of Surveys and Studies: Facts or Fake News?
- Activity 1.1: Keep the Change: Collecting Data
- Activity 1.2: Identifying Misleading Statistics
- Using Technology: Accessing and Listing Data
- Chapter 2. Methods for Describing Sets of Data
- 2.1 Describing Qualitative Data
- 2.2 Graphical Methods for Describing Quantitative Data
- 2.3 Numerical Measures of Central Tendency
- 2.4 Numerical Measures of Variability
- 2.5 Using the Mean and Standard Deviation to Describe Data
- 2.6 Numerical Measures of Relative Standing
- 2.7 Methods for Detecting Outliers: Box Plots and z-Scores
- 2.8 Graphing Bivariate Relationships (Optional)
- 2.9 The Time Series Plot (Optional)
- 2.10 Distorting the Truth with Descriptive Techniques
- Statistics In Action: Can Money Buy Love?
- Activity 2.1: Real Estate Sales
- Activity 2.2: Keep the Change: Measures of Central Tendency and Variability
- Using Technology: Describing Data
- Making Business Decisions: The Kentucky Milk Case—Part I (Covers Chapters 1 and 2)
- Chapter 3. Probability
- 3.1 Events, Sample Spaces, and Probability
- 3.2 Unions and Intersections
- 3.3 Complementary Events
- 3.4 The Additive Rule and Mutually Exclusive Events
- 3.5 Conditional Probability
- 3.6 The Multiplicative Rule and Independent Events
- 3.7 Bayes’s Rule
- Statistics In Action: Lotto Buster!
- Activity 3.1: Exit Polls: Conditional Probability
- Activity 3.2: Keep the Change: Independent Events
- Using Technology: Combinations and Permutations
- Chapter 4. Random Variables and Probability Distributions
- 4.1 Two Types of Random Variables
- Part I: Discrete Random Variables
- 4.2 Probability Distributions for Discrete Random Variables
- 4.3 The Binomial Distribution
- 4.4 Other Discrete Distributions: Poisson and Hypergeometric
- Part II: Continuous Random Variables
- 4.5 Probability Distributions for Continuous Random Variables
- 4.6 The Normal Distribution
- 4.7 Descriptive Methods for Assessing Normality
- 4.8 Other Continuous Distributions: Uniform and Exponential
- Statistics In Action: Probability in a Reverse Cocaine Sting: Was Cocaine Really Sold?
- Activity 4.1: Warehouse Club Memberships: Exploring a Binomial Random Variable
- Activity 4.2: Identifying the Type of Probability Distribution
- Using Technology: Discrete Probabilities, Continuous Probabilities, and Normal Probability Plots
- Chapter 5. Sampling Distributions
- 5.1 The Concept of a Sampling Distribution
- 5.2 Properties of Sampling Distributions: Unbiasedness and Minimum Variance
- 5.3 The Sampling Distribution of the Sample Mean and the Central Limit Theorem
- 5.4 The Sampling Distribution of the Sample Proportion
- Statistics In Action: The Insomnia Pill: Is It Effective?
- Activity 5.1: Simulating a Sampling Distribution—Cell Phone Usage
- Using Technology: Simulating a Sampling Distribution
- Making Business Decisions: The Furniture Fire Case (Covers Chapters 3–5)
- Chapter 6. Inferences Based on a Single Sample: Estimation with Confidence Intervals
- 6.1 Identifying and Estimating the Target Parameter
- 6.2 Confidence Interval for a Population Mean: Normal (z) Statistic
- 6.3 Confidence Interval for a Population Mean: Student’s t-Statistic
- 6.4 Large-Sample Confidence Interval for a Population Proportion
- 6.5 Determining the Sample Size
- 6.6 Finite Population Correction for Simple Random Sampling (Optional)
- 6.7 Confidence Interval for a Population Variance (Optional)
- Statistics In Action: Medicare Fraud Investigations
- Activity 6.1: Conducting a Pilot Study
- Using Technology: Confidence Intervals and Sample Size Determination
- Chapter 7. Inferences Based on a Single Sample: Tests of Hypotheses
- 7.1 The Elements of a Test of Hypothesis
- 7.2 Formulating Hypotheses and Setting Up the Rejection Region
- 7.3 Observed Significance Levels: p-Values
- 7.4 Test of Hypothesis About a Population Mean: Normal (z) Statistic
- 7.5 Test of Hypothesis About a Population Mean: Student’s t-Statistic
- 7.6 Large-Sample Test of Hypothesis About a Population Proportion
- 7.7 Test of Hypothesis About a Population Variance
- 7.8 Calculating Type II Error Probabilities: More About β (Optional)
- Statistics In Action: Diary of a Kleenex® User—How Many Tissues in a Box?
- Activity 7.1: Challenging a Company’s Claim: Tests of Hypotheses
- Activity 7.2: Keep the Change: Tests of Hypotheses
- Using Technology: Tests of Hypotheses
- Chapter 8. Inferences Based on Two Samples: Confidence Intervals and Tests of Hypotheses
- 8.1 Identifying the Target Parameter
- 8.2 Comparing Two Population Means: Independent Sampling
- 8.3 Comparing Two Population Means: Paired Difference Experiments
- 8.4 Comparing Two Population Proportions: Independent Sampling
- 8.5 Determining the Required Sample Size
- 8.6 Comparing Two Population Variances: Independent Sampling
- Statistics In Action: ZixIt Corp. v. Visa USA Inc.—A Libel Case
- Activity 8.1: Box Office Receipts: Comparing Population Means
- Activity 8.2: Keep the Change: Inferences Based on Two Samples
- Using Technology: Two-Sample Inferences
- Making Business Decisions: The Kentucky Milk Case—Part II (Covers Chapters 6–8)
- Chapter 9. Design of Experiments and Analysis of Variance
- 9.1 Elements of a Designed Experiment
- 9.2 The Completely Randomized Design: Single Factor
- 9.3 Multiple Comparisons of Means
- 9.4 The Randomized Block Design
- 9.5 Factorial Experiments: Two Factors
- Statistics In Action: Tax Compliance Behavior—Factors That Affect Your Level of Risk Taking When F
- Activity 9.1: Designed vs. Observational Experiments
- Using Technology: Analysis of Variance
- Chapter 10. Categorical Data Analysis
- 10.1 Categorical Data and the Multinomial Experiment
- 10.2 Testing Category Probabilities: One-Way Table
- 10.3 Testing Category Probabilities: Two-Way (Contingency) Table
- 10.4 A Word of Caution About Chi-Square Tests
- Statistics In Action: The Illegal Transplant Tissue Trade—Who Is Responsible for Paying Damages?
- Activity 10.1: Binomial vs. Multinomial Experiments
- Activity 10.2: Contingency Tables
- Using Technology: Chi-Square Analyses
- Making Business Decisions: Discrimination in the Workplace (Covers Chapters 9–10)
- Chapter 11. Simple Linear Regression
- 11.1 Probabilistic Models
- 11.2 Fitting the Model: The Least Squares Approach
- 11.3 Model Assumptions
- 11.4 Assessing the Utility of the Model: Making Inferences About the Slope β1
- 11.5 The Coefficients of Correlation and Determination
- 11.6 Using the Model for Estimation and Prediction
- 11.7 A Complete Example
- Statistics In Action: Legal Advertising—Does It Pay?
- Activity 11.1: Applying Simple Linear Regression to Your Favorite Data
- Using Technology: Simple Linear Regression
- Chapter 12. Multiple Regression and Model Building
- 12.1 Multiple Regression Models
- Part I: First-Order Models With Quantitative Independent variables
- 12.2 Estimating and Making Inferences About the β Parameters
- 12.3 Evaluating Overall Model Utility
- 12.4 Using the Model for Estimation and Prediction
- Part II: Model Building In Multiple Regression
- 12.5 Interaction Models
- 12.6 Quadratic and Other Higher-Order Models
- 12.7 Qualitative (Dummy) Variable Models
- 12.8 Models with Both Quantitative and Qualitative Variables
- 12.9 Comparing Nested Models
- 12.10 Stepwise Regression
- Part III: Multiple Regression Diagnostics
- 12.11 Residual Analysis: Checking the Regression Assumptions
- 12.12 Some Pitfalls: Estimability, Multicollinearity, and Extrapolation
- Statistics In Action: Bid Rigging in the Highway Construction Industry
- Activity 12.1: Insurance Premiums: Collecting Data for Several Variables
- Activity 12.2: Collecting Data and Fitting a Multiple Regression Model
- Using Technology: Multiple Regression
- Making Business Decisions: The Condo Sales Case (Covers Chapters 11–12)
- Chapter 13. Methods for Quality Improvement: Statistical Process Control
- 13.1 Quality, Processes, and Systems
- 13.2 Statistical Control
- 13.3 The Logic of Control Charts
- 13.4 A Control Chart for Monitoring the Mean of a Process: The x-Chart
- 13.5 A Control Chart for Monitoring the Variation of a Process: The R-Chart
- 13.6 A Control Chart for Monitoring the Proportion of Defectives Generated by a Process: The p-Chart
- 13.7 Diagnosing the Causes of Variation
- 13.8 Capability Analysis
- Statistics In Action: Testing Jet Fuel Additive for Safety
- Activity 13.1: Quality Control: Consistency
- Using Technology: Control Charts
- Making Business Decisions: The Gasket Manufacturing Case (Covers Chapter 13)
- Chapter 14. Time Series: Descriptive Analyses, Models, and Forecasting
- 14.1 Descriptive Analysis: Index Numbers
- 14.2 Descriptive Analysis: Exponential Smoothing
- 14.3 Time Series Components
- 14.4 Forecasting: Exponential Smoothing
- 14.5 Forecasting Trends: Holt’s Method
- 14.6 Measuring Forecast Accuracy: MAD and RMSE
- 14.7 Forecasting Trends: Simple Linear Regression
- 14.8 Seasonal Regression Models
- 14.9 Autocorrelation and the Durbin-Watson Test
- Statistics In Action: Forecasting the Monthly Sales of a New Cold Medicine
- Activity 14.1: Time Series
- Using Technology: Forecasting
- Chapter 15. Nonparametric Statistics
- 15.1 Introduction: Distribution-Free Tests
- 15.2 Single Population Inferences
- 15.3 Comparing Two Populations: Independent Samples
- 15.4 Comparing Two Populations: Paired Difference Experiment
- 15.5 Comparing Three or More Populations: Completely Randomized Design
- 15.6 Comparing Three or More Populations: Randomized Block Design
- 15.7 Rank Correlation
- Statistics In Action: Pollutants at a Housing Development—A Case of Mishandling Small Samples
- Activity 15.1: Keep the Change: Nonparametric Statistics
- Using Technology: Nonparametric Tests
- Making Business Decisions: Detecting “Sales Chasing” (Covers Chapters 10 and 15)
- Appendix A: Summation Notation
- Appendix B: Basic Counting Rules
- Appendix C: Calculation Formulas for Analysis of Variance
- C.1 Formulas for the Calculations in the Completely Randomized Design
- C.2 Formulas for the Calculations in the Randomized Block Design
- C.3 Formulas for the Calculations for a Two-Factor Factorial Experiment
- C.4 Tukey’s Multiple Comparisons Procedure (Equal Sample Sizes)
- C.5 Bonferroni Multiple Comparisons Procedure (Pairwise Comparisons)
- C.6 Scheffé’s Multiple Comparisons Procedure (Pairwise Comparisons)
- Appendix D: Tables
- Table I Binomial Probabilities
- Table II Normal Curve Areas
- Table III Critical Values of t
- Table IV Critical Values of x2
- Table V Percentage Points of the F-Distribution, α = .10
- Table VI Percentage Points of the F-Distribution, α = .05
- Table VII Percentage Points of the F-Distribution, α = .025
- Table VIII Percentage Points of the F-Distribution, α = .01
- Table IX Control Chart Constants
- Table X Critical Values for the Durbin-Watson d-Statistic, α = .05
- Table XI Critical Values for the Durbin-Watson d-Statistic, α = .01
- Table XII Critical Values of TL and TU for the Wilcoxon Rank Sum Test: Independent Samples
- Table XIII Critical Values of T0 in the Wilcoxon Paired Difference Signed Rank Test
- Table XIV Critical Values of Spearman’s Rank Correlation Coefficient
- Table XV Critical Values of the Studentized Range, α = .05
- Answers to Selected Exercises
- Index
- Credits
- Selected Formulas


Reviews
There are no reviews yet.