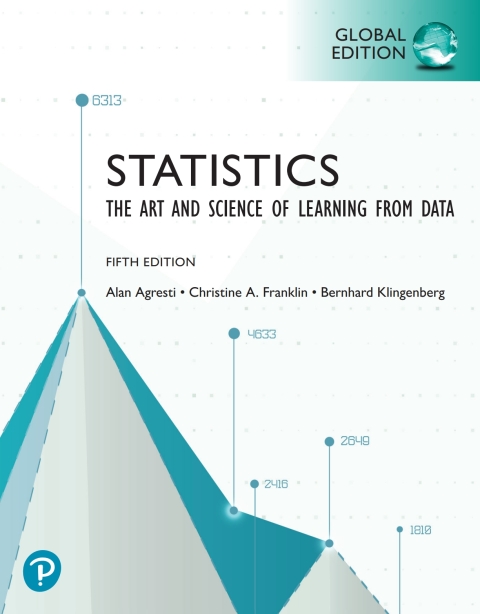
Description
Efnisyfirlit
- Title Page
- Copyright
- Dedication
- Contents
- An Introduction to the Web Apps
- Preface
- About the Authors
- Part One: Gathering and Exploring Data
- Chapter 1. Statistics: The Art and Science of Learning From Data
- 1.1 Using Data to Answer Statistical Questions
- 1.2 Sample Versus Population
- 1.3 Organizing Data, Statistical Software, and the New Field of Data Science
- Chapter Summary
- Chapter Exercises
- Chapter 2. Exploring Data With Graphs and Numerical Summaries
- 2.1 Different Types of Data
- 2.2 Graphical Summaries of Data
- 2.3 Measuring the Center of Quantitative Data
- 2.4 Measuring the Variability of Quantitative Data
- 2.5 Using Measures of Position to Describe Variability
- 2.6 Linear Transformations and Standardizing
- 2.7 Recognizing and Avoiding Misuses of Graphical Summaries
- Chapter Summary
- Chapter Exercises
- Chapter 3. Exploring Relationships Between Two Variables
- 3.1 The Association Between Two Categorical Variables
- 3.2 The Relationship Between Two Quantitative Variables
- 3.3 Linear Regression: Predicting the Outcome of a Variable
- 3.4 Cautions in Analyzing Associations
- Chapter Summary
- Chapter Exercises
- Chapter 4. Gathering Data
- 4.1 Experimental and Observational Studies
- 4.2 Good and Poor Ways to Sample
- 4.3 Good and Poor Ways to Experiment
- 4.4 Other Ways to Conduct Experimental and Nonexperimental Studies
- Chapter Summary
- Chapter Exercises
- Part Two: Probability, Probability Distributions, and Sampling Distributions
- Chapter 5. Probability in Our DailyLives
- 5.1 How Probability Quantifies Randomness
- 5.2 Finding Probabilities
- 5.3 Conditional Probability
- 5.4 Applying the Probability Rules
- Chapter Summary
- Chapter Exercises
- Chapter 6. Random Variables and Probability Distributions
- 6.1 Summarizing Possible Outcomes and Their Probabilities
- 6.2 Probabilities for Bell-Shaped Distributions: The Normal Distribution
- 6.3 Probabilities When Each Observation Has Two Possible Outcomes: The Binomial Distribution
- Chapter Summary
- Chapter Exercises
- Chapter 7. Sampling Distributions
- 7.1 How Sample Proportions Vary Around the Population Proportion
- 7.2 How Sample Means Vary Around the Population Mean
- 7.3 Using the Bootstrap to Find Sampling Distributions
- Chapter Summary
- Chapter Exercises
- Part Three: Inferential Statistics
- Chapter 8. Statistical Inference: Confidence Intervals
- 8.1 Point and Interval Estimates of Population Parameters
- 8.2 Confidence Interval for a Population Proportion
- 8.3 Confidence Interval for a Population Mean
- 8.4 Bootstrap Confidence Intervals
- Chapter Summary
- Chapter Exercises
- Chapter 9. Statistical Inference: Significance Tests About Hypotheses
- 9.1 Steps for Performing a Significance Test
- 9.2 Significance Test About a Proportion
- 9.3 Significance Test About a Mean
- 9.4 Decisions and Types of Errors in Significance Tests
- 9.5 Limitations of Significance Tests
- 9.6 The Likelihood of a Type II Error and the Power of a Test
- Chapter Summary
- Chapter Exercises
- Chapter 10. Comparing Two Groups
- 10.1 Categorical Response: Comparing Two Proportions
- 10.2 Quantitative Response: Comparing Two Means
- 10.3 Comparing Two Groups With Bootstrap or Permutation Resampling
- 10.4 Analyzing Dependent Samples
- 10.5 Adjusting for the Effects of Other Variables
- Chapter Summary
- Chapter Exercises
- Part Four: Extended Statistical Methods and Models for Analyzing Categorical and Quantitative Variab
- Chapter 11. Categorical Data Analysis
- 11.1 Independence and Dependence (Association)
- 11.2 Testing Categorical Variables for Independence
- 11.3 Determining the Strength of the Association
- 11.4 Using Residuals to Reveal the Pattern of Association
- 11.5 Fisher’s Exact and Permutation Tests
- Chapter Summary
- Chapter Exercises
- Chapter 12. Regression Analysis
- 12.1 The Linear Regression Model
- 12.2 Inference About Model Parameters and the Relationship
- 12.3 Describing the Strength of the Relationship
- 12.4 How the Data Vary Around the Regression Line
- 12.5 Exponential Regression: A Model for Nonlinearity
- Chapter Summary
- Chapter Exercises
- Chapter 13. Multiple Regression
- 13.1 Using Several Variables to Predict a Response
- 13.2 Extending the Correlation Coefficient and R2 for Multiple Regression
- 13.3 Inferences Using Multiple Regression
- 13.4 Checking a Regression Model Using Residual Plots
- 13.5 Regression and Categorical Predictors
- 13.6 Modeling a Categorical Response: Logistic Regression
- Chapter Summary
- Chapter Exercises
- Chapter 14. Comparing Groups: Analysis of Variance Methods
- 14.1 One-Way ANOVA: Comparing Several Means
- 14.2 Estimating Differences in Groups for a Single Factor
- 14.3 Two-Way ANOVA: Exploring Two Factors and Their Interaction
- Chapter Summary
- Chapter Exercises
- Chapter 15. Nonparametric Statistics
- 15.1 Compare Two Groups by Ranking
- 15.2 Nonparametric Methods for Several Groups and for Dependent Samples
- Chapter Summary
- Chapter Exercises
- Appendix
- Answers
- Index
- A
- B
- C
- D
- E
- F
- G
- H
- I
- J
- K
- L
- M
- N
- O
- P
- Q
- R
- S
- T
- U
- V
- W
- X
- Y
- Z
- Index of Applications
- A
- B
- C
- D
- E
- F
- G
- H
- I
- J
- K
- L
- M
- N
- O
- P
- Q
- R
- S
- T
- U
- V
- W
- Credits


Reviews
There are no reviews yet.